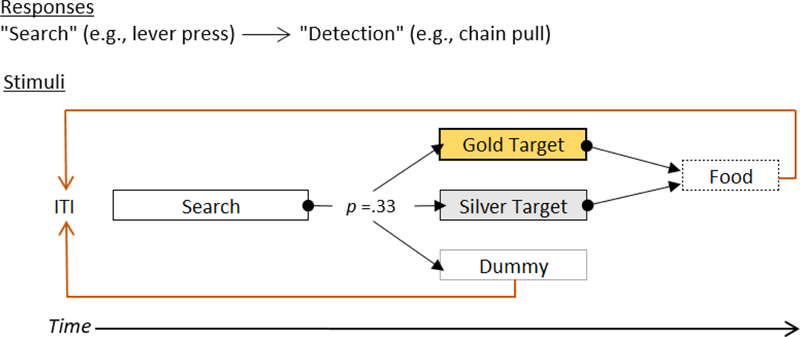
Figure 1.

Timeline of events in our search➔detection chain procedure. The flowchart describes the behavioral chain learned in the acquisition training phases of each experiment. “ITI” = intertrial interval, Manipulanda corresponding to the Search and Target responses were counterbalanced. “p = .33” refers the equal chance that search contingently led to the presentation of Gold Target, Silver Target, or started the next ITI ( “Dummy”) with equal likelihood on each trial. The sequence of events repeated itself across time in the session. See text for details.
