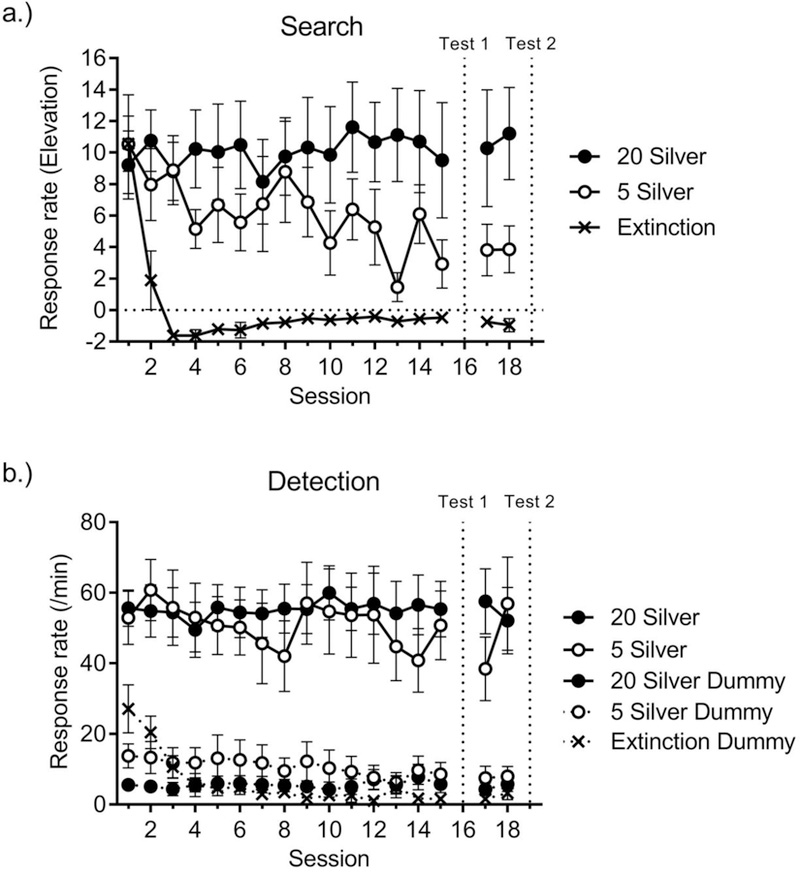
Figure 7.

Work phase responding in Experiment 2. a.) Search response rates (elevation) and b.) Detection response rates over sessions of the work phase. The search➔detection chain test (Test 1) and detection test (Test 2), the results of which are shown in Figures 8 and 9, occurred on days 16 and 19, respectively. Error bars are the standard error of the mean.
