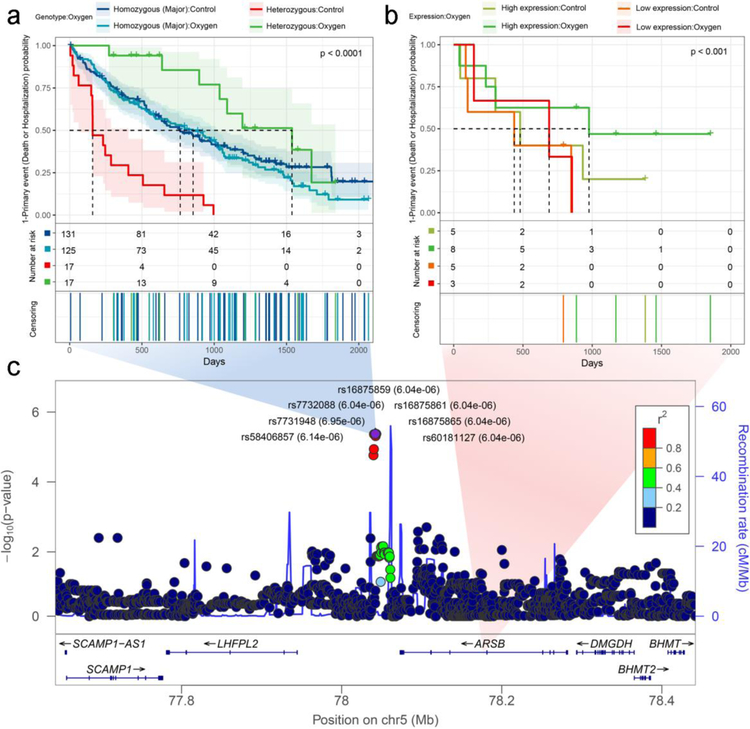
Figure 3. Time-to-event analyses of the ARSB gene and adjacent 7 SNPs in LOTT.
(a) Kaplan-Meier plot of ARSB SNPs in genetic data analysis. These SNPs are located at 5q 14.1 and exhibit strong linkage disequilibrium; therefore, rs7732088 was used as representative SNP. (b) Kaplan-Meier plot of ARSB gene expression. (c) LocusZoom plot for genome-wide time-to-event analysis for SNPs identified near ARSB.

