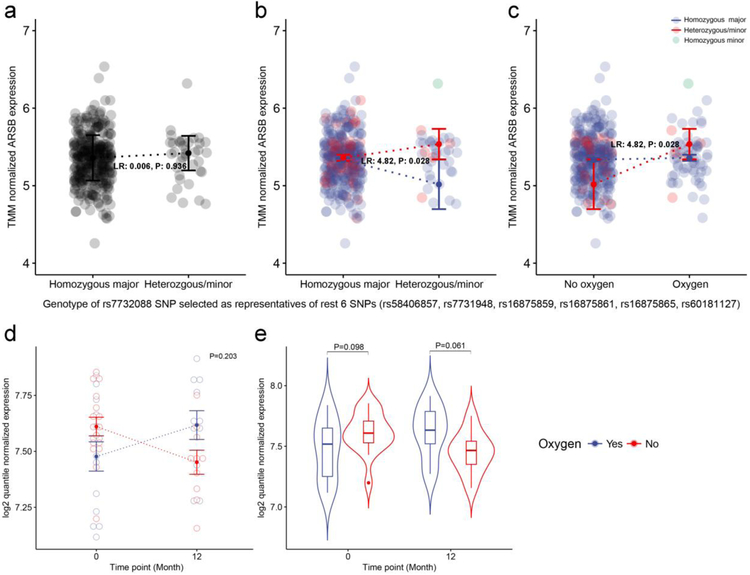
Figure 4. Conventional and conditional eQTL analysis of ARSB gene in the COPDGene Study.
(a) Conventional eQTL plot between TMM normalizedARSB expression and dominant coded genotype of the rs7732088 SNP selected as representative of 7 SNPs. (b) Conditional eQTL plot showing interaction effect between genotype and oxygen effect. The dotted-line and error bar represent mean±SEM. (c) Same data as in part (b), with oxygen treatment plotted on the x-axis. (d) Longitudinal gene expression pattern of the ARSB gene. There was no significant interaction (P= 0.20). (e) ARSB gene expression at screening and 12-month follow-up. There was no significant differential expression based on oxygen treatment at either time point.

