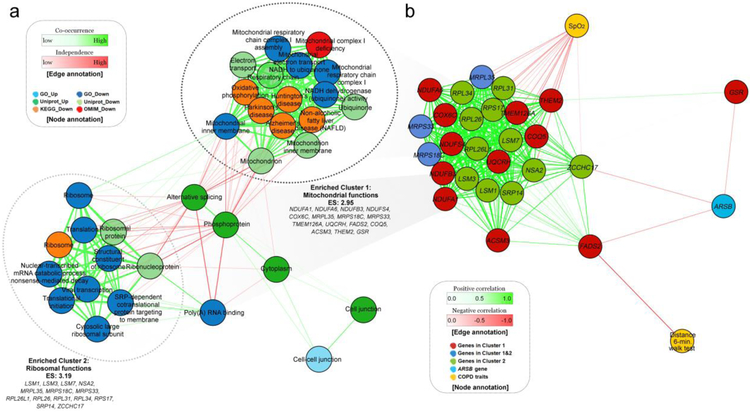
Figure 5. Network plots of LOTT gene expression analysis.
(a) Network plot for DAVID functional enrichment analysis using up- and down-regulated genes in the oxygen group in longitudinal gene expression analysis. Two functional clusters were observed in down-regulated genes at FDR adjusted P < 0.1. (b) Correlation-based network of co-expressed genes and COPD related traits.

