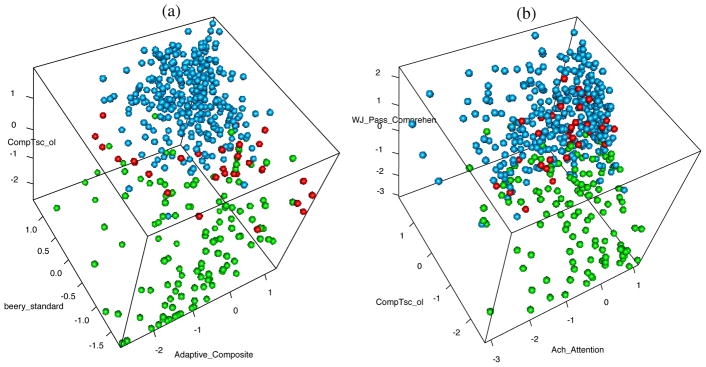
Figure 4.
Three dimensional scatter plots of the tests on standardized scale: (a) The most informative three variables with estimated cluster membership. (b) Observations plotted on the variables CompTsc_ol, WJ_Pass_Comprehen, and Ach_abc_Attention, to better illustrate the separation of clusters 2 and 3.

