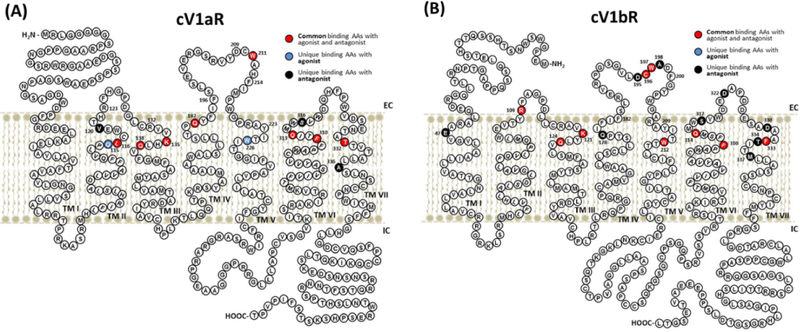
Figure 3. Two-dimensional schematic diagrams of cV1aR (A) and cV1bR (B) showing the amino acid residues involved in interactions with agonist and antagonists.

Common binding sites with agonist and antagonists in the modelled structures are shown in red and unique binding AAs with agonist and antagonists are shown in blue and dark purple coloration, respectively.
