Figure 4.

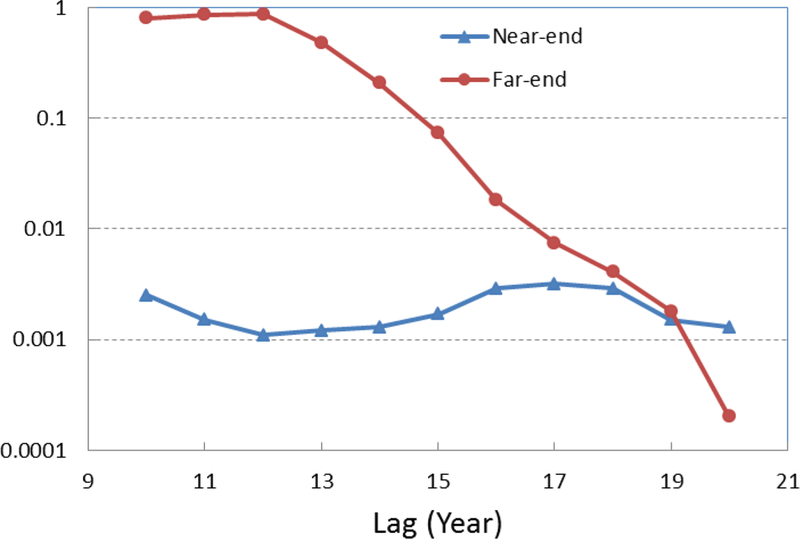
The p-values of endpoint constraints for effect of red meat on CRC. The p-value decreases as the lag increases. Lags of greater than 17 years are statistically significant (both endpoints have small p-values).

The p-values of endpoint constraints for effect of red meat on CRC. The p-value decreases as the lag increases. Lags of greater than 17 years are statistically significant (both endpoints have small p-values).