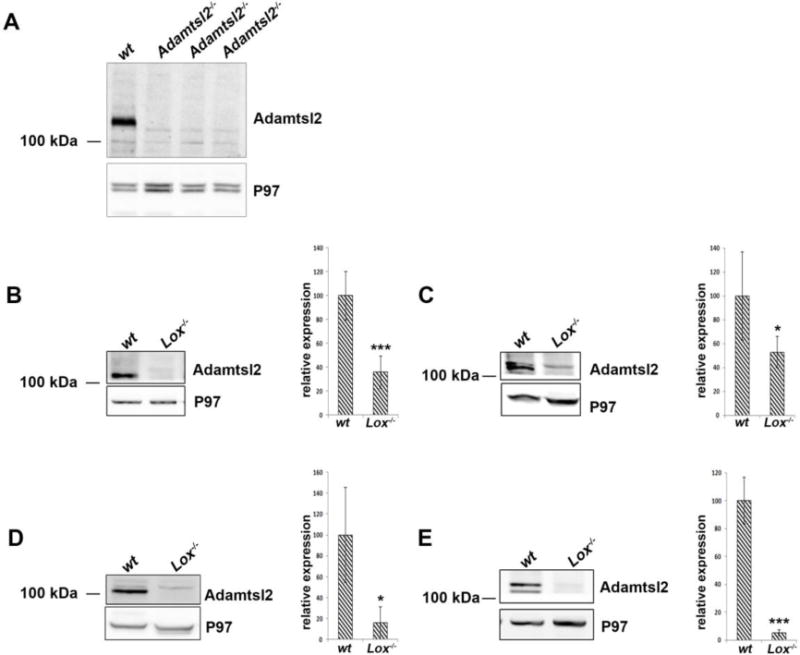
Figure 4. ADAMTSL2 content is significantly reduced in mouse Lox−/− tissues.

A. Western blot for ADAMTSL2 from wt and Adamtsl2−/− embryos demonstrating ADAMTSL2 antibody specificity (A). B. Western blot analysis from E18.5 wt and Lox−/− mouse eye (B), limb (C), lung (D) and brain (E) lysates. Distinct ADAMTSL2 protein bands, may arise from different glycosylation and/or processing in the different tissues. Molecular mass markers are shown on the left. Quantification of ADAMTSL2 levels measured from western blots (n=4 for each genotype) are shown to the right of each blot. Membranes were incubated with anti-ADAMTSL2 and anti-P97 as a control. * and *** indicate p< 0.05 and p<0.001, respectively.
