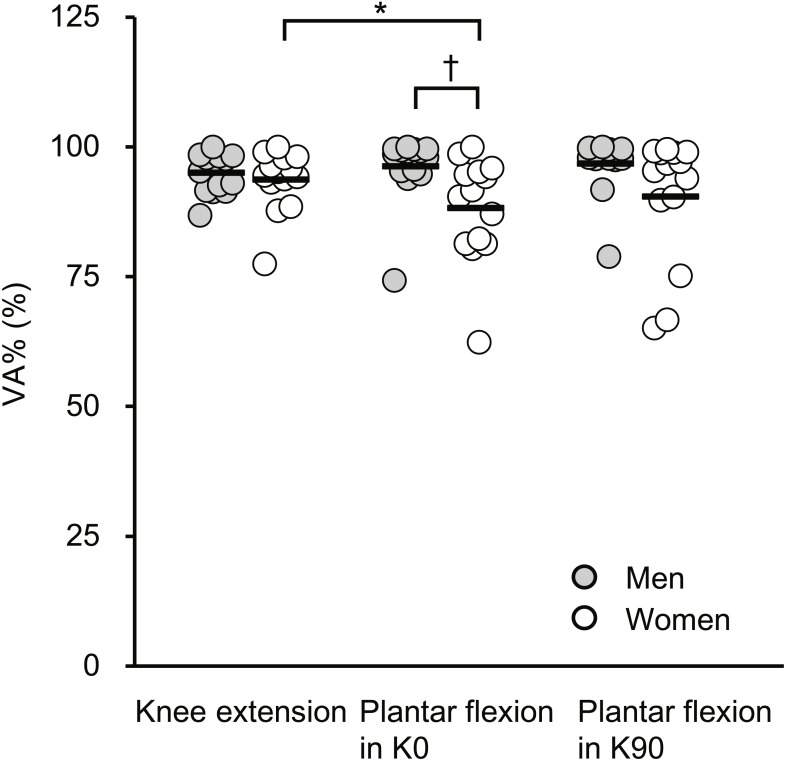
Figure 2. Scatterplots showing individual data of voluntary activation (VA%) during maximal voluntary contractions of knee extension, plantar flexion at extended (K0) and at flexed (K90) knee positions.
Solid line shows the mean value. *Indicates a significant difference between joint actions. † Shows a significant difference between sexes.

