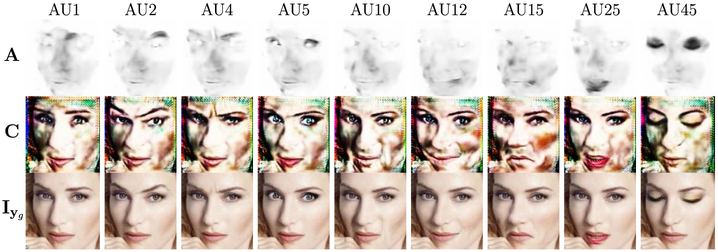
Fig. 5. Attention Model.
Details of the intermediate attention mask A (first row) and the color mask C (second row). The bottom row images are the synthesized expressions. Darker regions of the attention mask A show those areas of the image more relevant for each specific AU. Brighter areas are retained from the original image.

