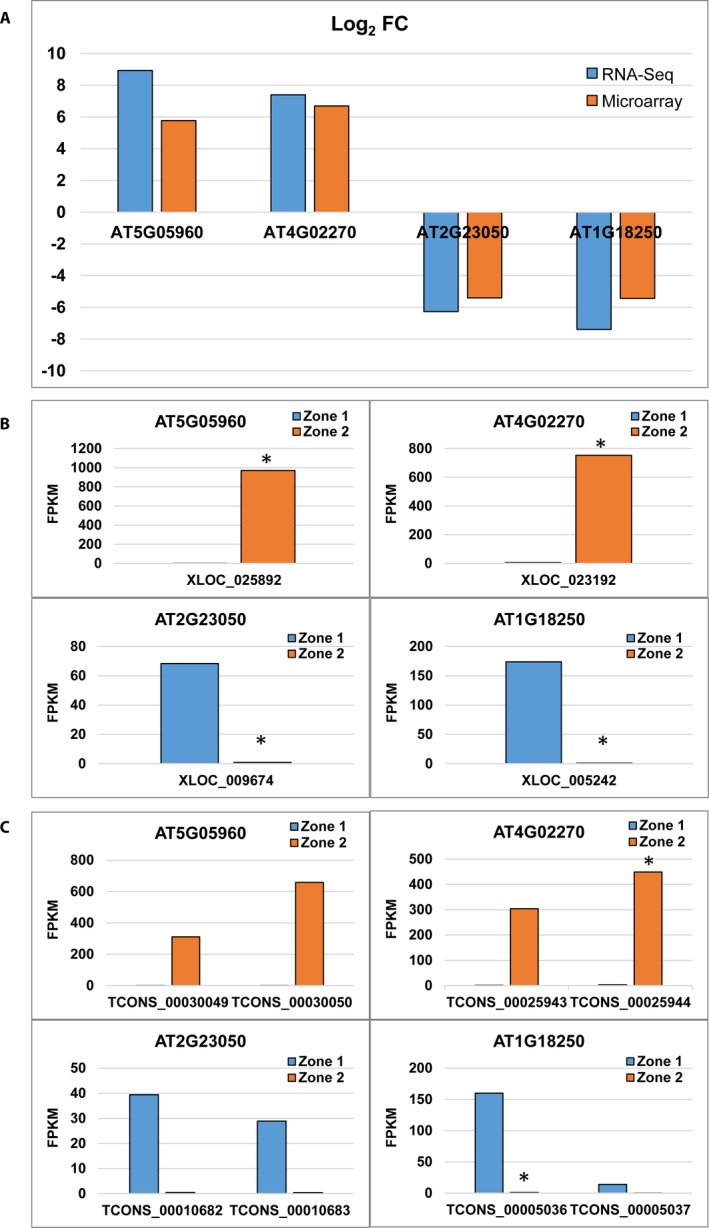
Figure 3.

Transcript/isoform information of selected genes. Differential expression analysis results for AT5G05960 (protease inhibitor/seed storage/lipid transfer protein [LTP] family protein), AT4G02270 (pollen Ole e 1 allergen and extensin family protein), AT2G23050 (NPY4 [NAKED PINS IN YUC MUTANTS 4]; protein binding/signal transducer [NPY4]), and AT1G18250 (thaumatin‐like protein ATLP‐1). (A) Log2 FC values for the genes in RNA‐Seq and microarray. (B, C) Expression plots of genes (B) and isoforms (C) showing the differences in expression in root Zone 1 and 2, measured in FPKM.
