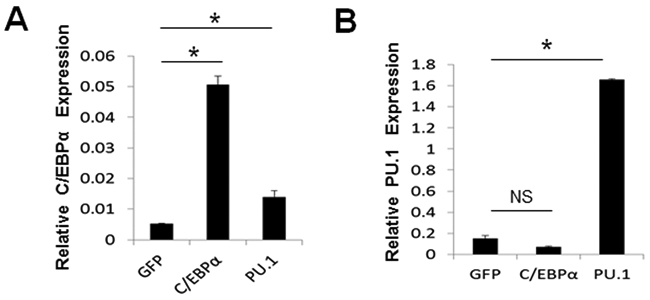
Fig. 2.

Analysis of the effects of C/EBPα or PU.1 in inducing the expressions of each other. A, analysis of C/EBPα expression in BMMs expressing a GFP control (GFP), FLAG-C/EBPα (C/EBPα), or FLAG-PU.1 (PU.1) cultured with M-CSF for 4 days by qPCR. B, analysis of PU.1 expression in BMMs expressing GFP, C/EBPα, or PU.1 cultured with M-CSF for 4 days. Error bars show averages ± S.D. *, p < 0.05. NS, not significant.
