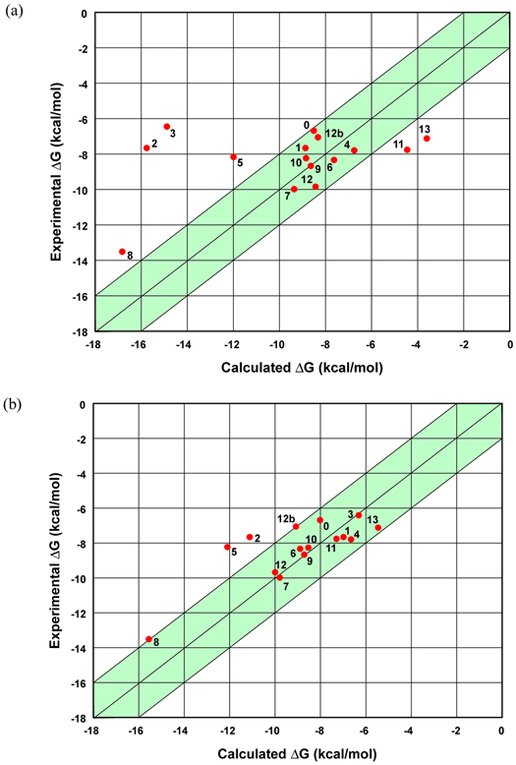
Figure 3.
(a) A plot of the initial AMOEBA predictions for the host-guest binding free energies. (b) A plot of the revised AMOEBA results for the CB[8] host and guests. The shaded green regions represent deviations within 2 kcal/mol from experiment. In both plots, the 12b point is the binding of a second guest 12 molecule to an existing 1:1 CB[8]/guest 12 complex.

