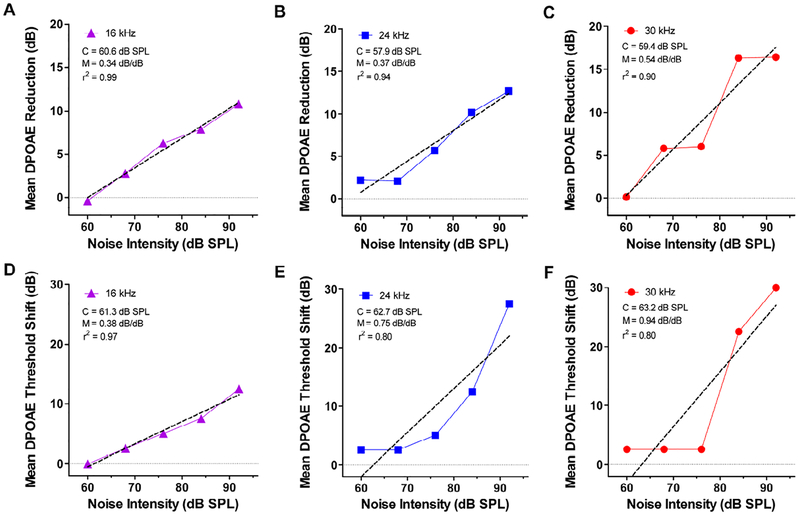
Figure 5:
Mean DPOAE amplitude reductions and mean DPOAE threshold shifts versus noise exposure intensity. Mean reduction in DPOAE amplitude relative to baseline DPOAE amplitudes plotted as function of noise exposure intensities from 60–92 dB SPL for (A) 16 kHz, (B) 24 kHz and (C) 30 kHz. Dashed line shows linear regression fit to the data. The critical intensity (C) and slope (M) and r2 values of the linear regression line are shown in each panel. Mean DPOAE threshold shift relative to baseline thresholds plotted as a function of noise exposure intensities from 60–92 dB SPL for (D) 16 kHz, (E) 24 kHz and (C) 30 kHz. Dashed line shows linear regression fit to the data. Values of C, M and r2 for the linear regression line shown in each panel.

