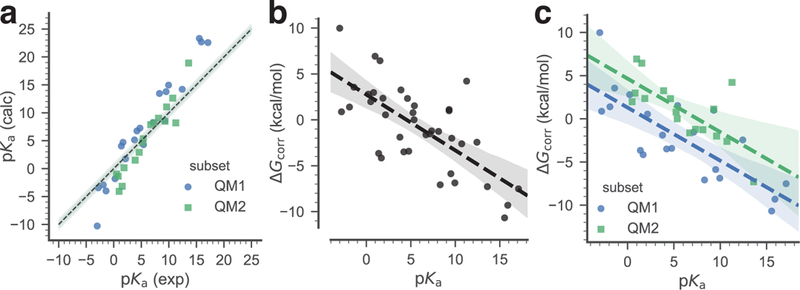
Fig. 4.

Training data set. The pKa of the training data set compounds are used to derive a simple linear model that relates the free energy correction to the experimental pKa. Two linear models were derived: a global linear model (black dashed line), utilizing all data, and a piecewise linear model that applies to either neutral acids (subset QM1, blue) or to positively charged acids (subset QM2, green). a: Correlation between experimental and calculated pKa of the training data set. The dashed line indicates ideal correlation with the gray band indicating 1 pKa unit deviation. b: Global linear fit of the calculated to the experimental pKa. c: Linear fits of the calculated to the experimental pKa, split between the QM1 and the QM2 subsets. In (b) and (c) the dashed lines are linear models to the data, with shaded bands indicating 95% confidence intervals from 1000 bootstrap samples.
