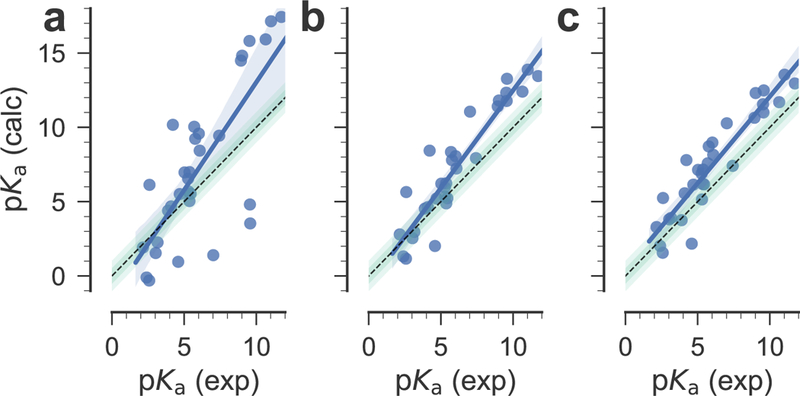
Fig. 6.

Correlation between experimental and calculated pKa values for the SAMPL6 compounds. a: pKa were directly estimated from the quantum mechanical free energy differences. b: The quantum mechanical pKa were corrected with the global linear model. c: compounds were corrected depending on their membership in subsets 1 or 2. The black dashed line indicates ideal correlation, the shaded green bars show 0.5 and 1 pKa units deviation from ideal. Blue lines are linear regression fits to the data, with the blue shaded area indicating the 95% confidence interval from 1000 bootstrap samples.
