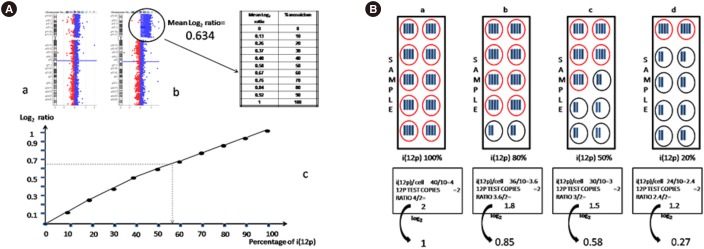
Fig. 1. Results of array CGH. (A) Array CGH profile of chromosome 12 performed on (a) peripheral blood DNA and (b) buccal swab where the average log2 ratio is approximately 0.634, consistent with a mosaicism of 50–60% i(12p) cells. (c) Relationship between the percentage of mosaicism (X-axis) and the log2 ratio (Y-axis) of the array CGH experiment is shown. (B) Diagram presenting the relationship between the percentage of i(12p) cells and the log2 ratio obtained. (a) If all the cells in the sample are tetrasomic for the 12p region, the number of copies of i(12p) per cell is 4. The ratio with a normal sample is 4/2=2, with a log2 of 1. (b) If 80% of the cells in the sample are tetrasomic for the 12p region, the number of copies of i(12p) per cell is 3.6. The ratio with a normal sample is 3.6/2=1.8, with a log2 of 0.85. (c and d) The values obtained in cases of 50% and 20% mosaicism are also shown.
Abbreviation: CGH, Comparative Genomic Hybridization.

