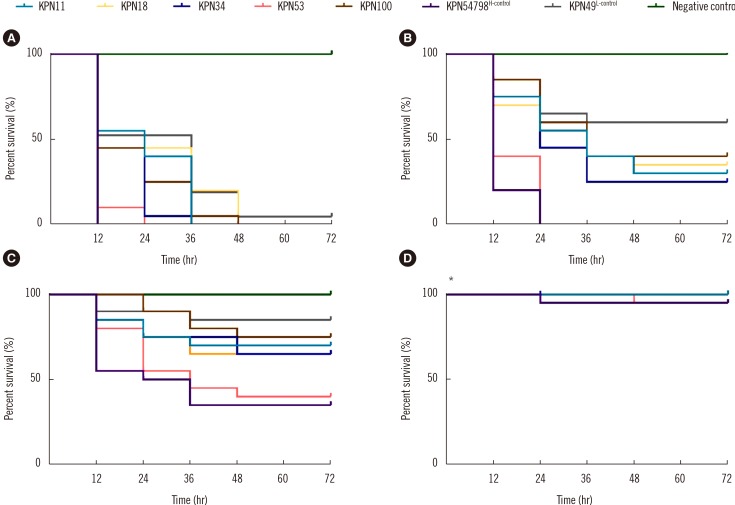
Fig. 3. Survival curves for G. mellonella larvae inoculated with 1×10⁷ (A), 1×10⁶ (B), 1×10⁵ (C), and 1×10⁴ (D) colony-forming units of the tested isolates, and the data shown are from a single representative experiment out of three repeats. *The curves of KPN11, KPN18, KPN34, KPN100, KPN49L-control and negative control are completely overlapping.
Abbreviations: H-control, hypervirulence control; L-control, low-virulence control.

