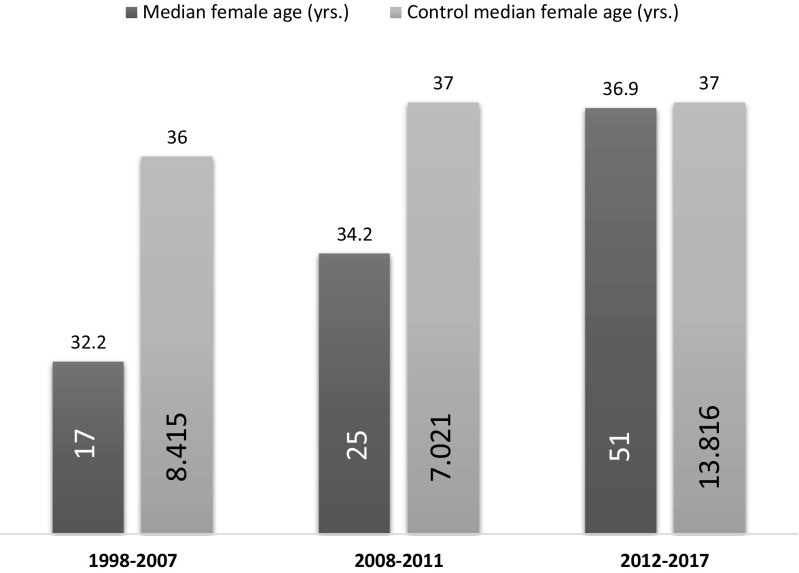
Fig. 1.
Age of the female partner at the start of infertility treatment. Female age has been stable over the last 20 years in the general population (light grey bar), while the study population (dark grey bar) has shown a trend towards an increase (p = 0.069), reaching the level of the general population in the last years

