Fig. 11.

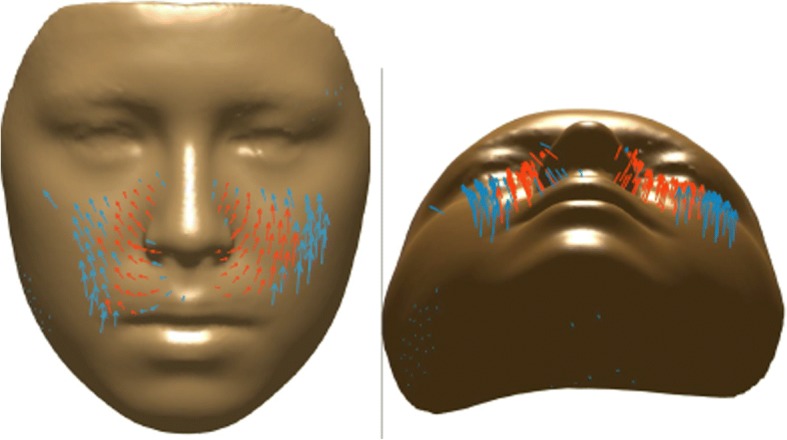
Vector map presents the direction of changes between T0 (initial, right before MSE placement) and T1 (immediately after expansion) time points. Blue arrows denote vectors with p < 0.05, and the red ones denote vectors with p < 0.01

Vector map presents the direction of changes between T0 (initial, right before MSE placement) and T1 (immediately after expansion) time points. Blue arrows denote vectors with p < 0.05, and the red ones denote vectors with p < 0.01