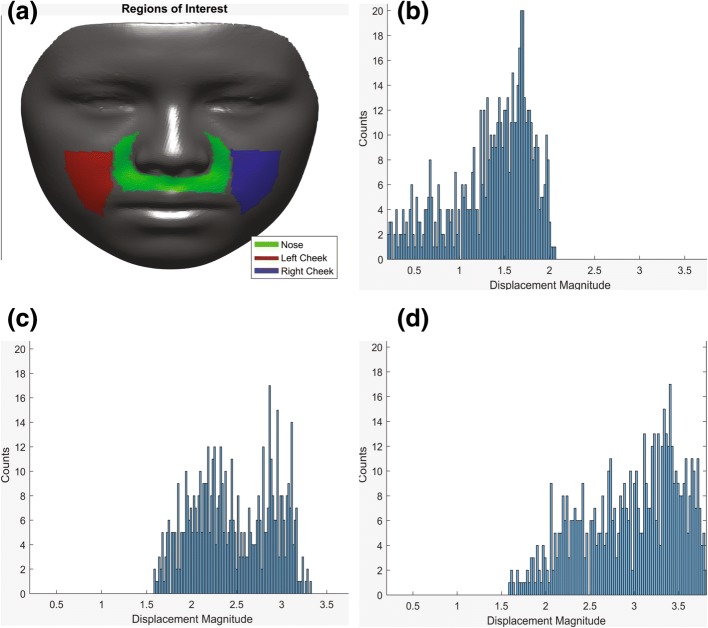
Fig. 12.
Face divided in three main areas of nose, right and left cheek to quantify the vectors (a). Magnitude of the vectors representing changes in each area presented in histogram (b–d). X-axis represents the vectors’ magnitude and Y-axis represents the number of vectors of each variable magnitudes

