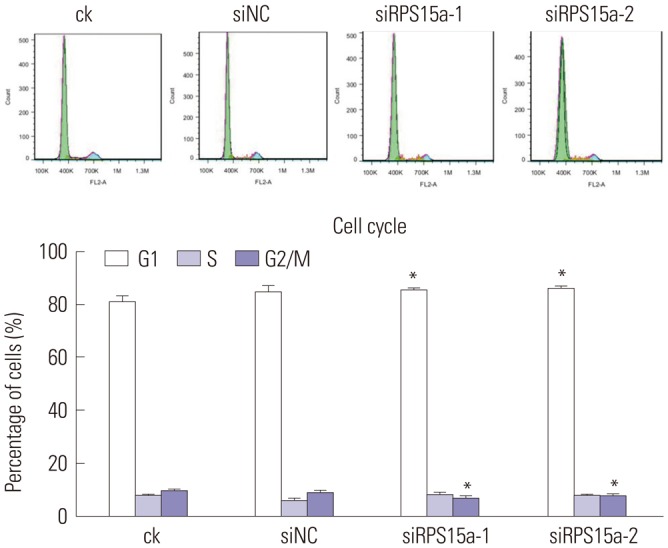
Fig. 6. Cell cycle analysis. The cell cycle distribution after ribosomal protein S15a (RPS15a) interference for 48 h was determined (*p<0.05). ck, normal BGC823 cells; siNC, BGC823 cells transfected with the negative control sequence; siRPS15a-1 and siRPS15a-2, BGC823 cells transfected with siRPS15a- 1- and siRPS15a-2-containing siRNA, respectively.

