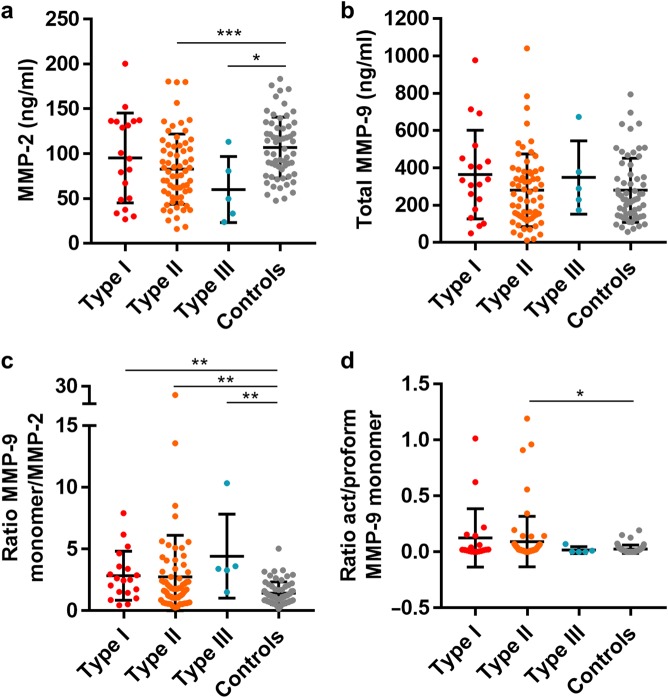
Fig. 2. Zymography analysis of achalasia.
Patients with defined achalasia type I, type II, type III, and controls were discriminated, and sera were analyzed as indicated in Fig. 1 and Supplemental Fig. 1. a MMP-2 levels in the serum of individual patients according to achalasia type. b MMP-9 levels in analyzed sera. c Ratios of MMP-9 versus MMP-2 regarding to types of achalasia. d Ratios of activated versus proMMP-9 monomer forms in the defined types. For all types of achalasia the mean levels ±SD are provided, *p < 0.05; **p < 0.01; ***p < 0.001

