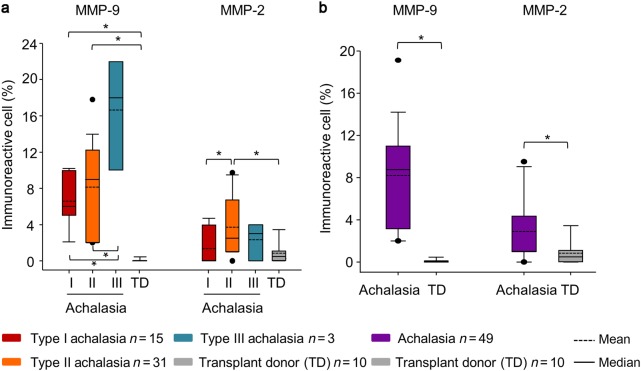
Fig. 4. Morphometrical analysis of immunoreactivities for MMP-9 and MMP-2.
a Percentages of immunoreactive cells per microscopic field for MMP-9 and for MMP-2 in type I, II, and III achalasia patients and esophageal tissue of transplant donors. b Overall tissue expression of MMP-9 and MMP-2 in an achalasia cohort. The results are expressed as mean (horizontal dotted line), median (solid line), and 5th/95th percentiles of MMP-9+ and MMP-2+ cells. Transplant donors (TD) were included as controls. *p < 0.05. Numbers of analyzed biopsies are provided together with the color codes

