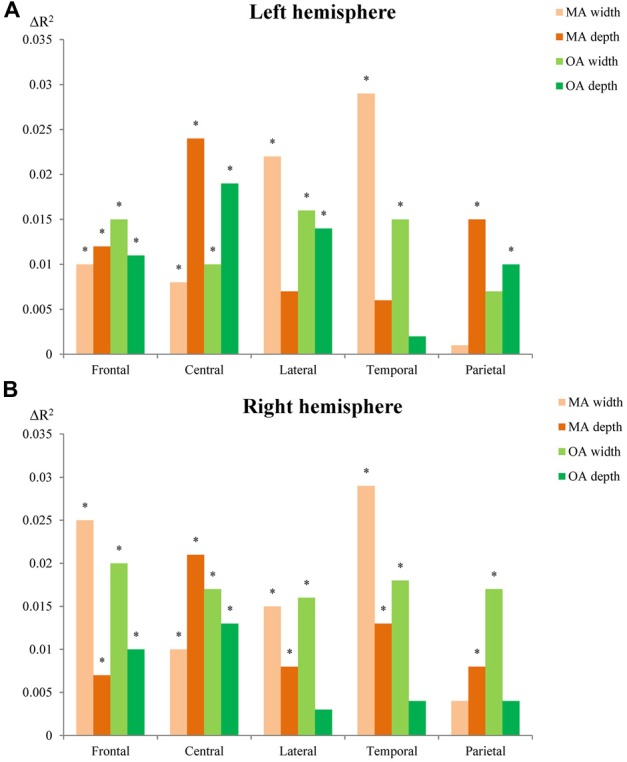
Figure 6.

Sensitivity of sulcal width and depth to local brain volumetric differences in the left (A) and right (B) hemispheres. MA, Middle age; OA, old age. The R-squared changes (ΔR2) indicate changes of explanatory power between models with and without sulcal width or depth (proportion of variability in the local gyral volumes explained by sulcal width or depth). *Indicates significant association (p < 0.01) between local gyral volumes and sulcal width or depth.
