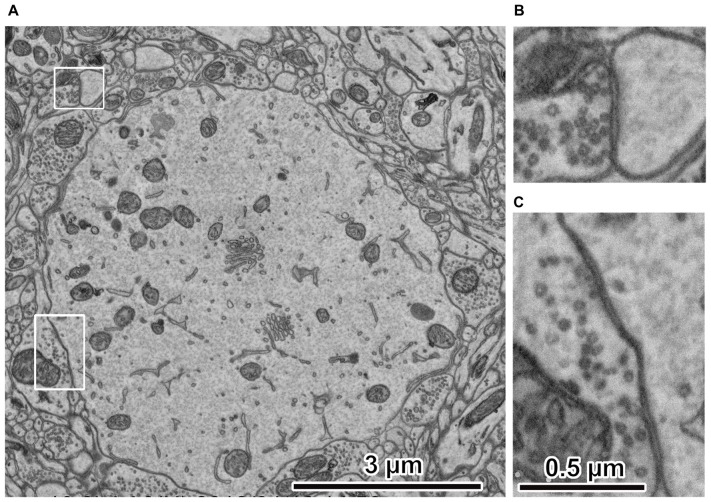
Figure 3.
Electron micrographs of rat cerebral cortex. (A) Ultrastructure of rat cerebral cortex. The peripheral portion of the cell body is at the center. The electron micrograph was captured using an acceleration voltage 1.5 keV, dwell time 3 μs/pixel, BSE detector, FE-SEM, Regulus 8240 (Hitachi High-Technologies Corp., Tokyo, Japan). (B) Spine synapse. An enlarged image in the upper left rectangle in (A). Synaptic vesicles and cleft are clearly observed. (C) Somatic synapse. Enlarged image in the lower left rectangle in (A). Synaptic vesicles and clefts are clearly observed. Adapted from Kubota and Kawaguchi (2018) and Kubota et al. (2018).

