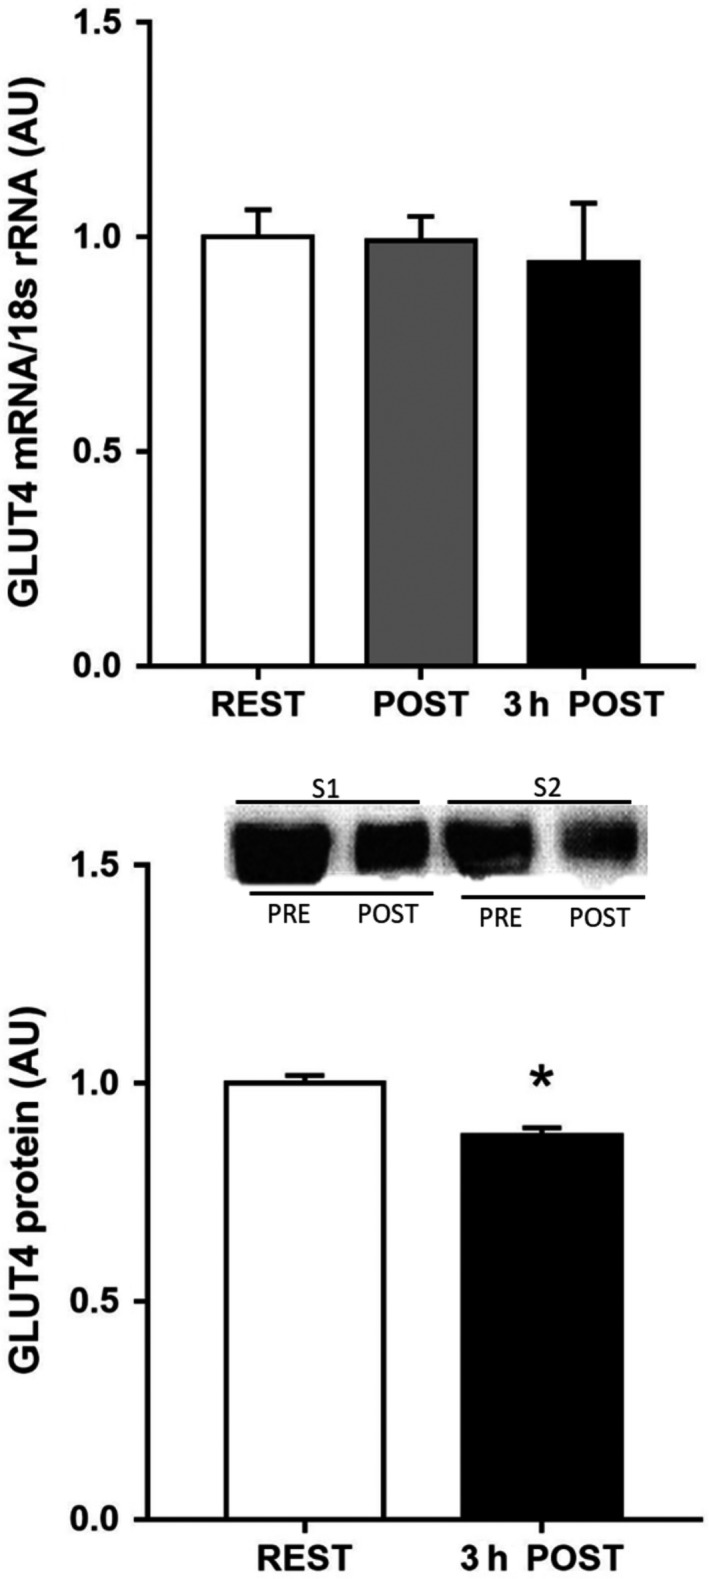
Figure 1.

GLUT4 mRNA expression before (PRE), immediately post (POST) and 3 h post (3 h POST) 60 min exercise at 73 ± 2% VO 2 peak, and GLUT4 protein expression (bottom panel) before and 3 h after exercise, in human, subcutaneous adipose tissue. Data are means ± SEM (n = 5 for mRNA and n = 7 for protein). * denotes different from PRE (P < 0.05–0.10).
