Figure 4.

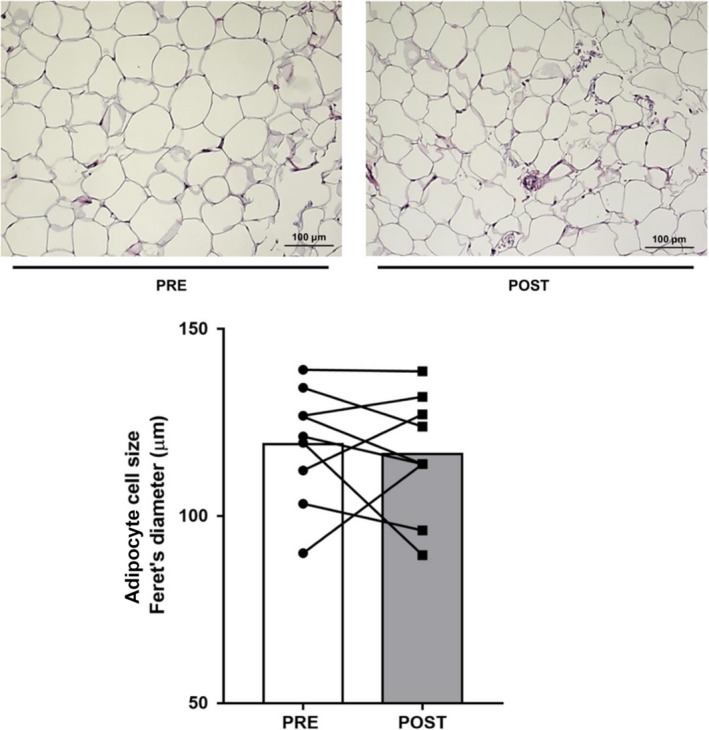
Representative micrographs of adipose tissue histology (top panels) and mean cell diameter (bottom panel) before (PRE) and after (POST) 10 days of exercise training. Individual responses and means shown.

Representative micrographs of adipose tissue histology (top panels) and mean cell diameter (bottom panel) before (PRE) and after (POST) 10 days of exercise training. Individual responses and means shown.