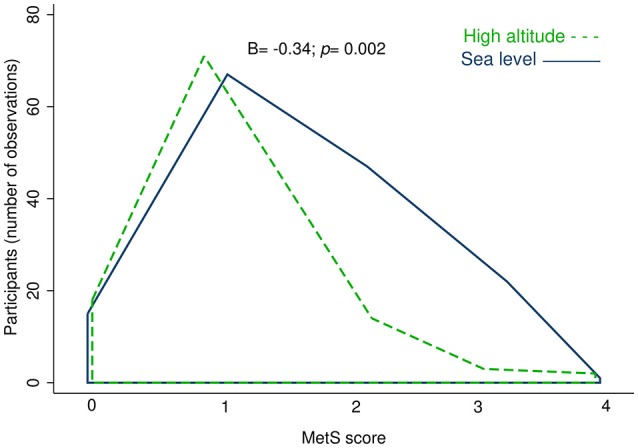
Figure 2.

Observed density of people by altitude for the summation of MetS components (MetS score). The high altitude is represented by the area under the green dashed line, and sea level area is displayed under the blue solid line. Model 1 adjusted for: age, sex, self-reported energy intake and residence time. B, Beta regression coefficient; p, p-value.
