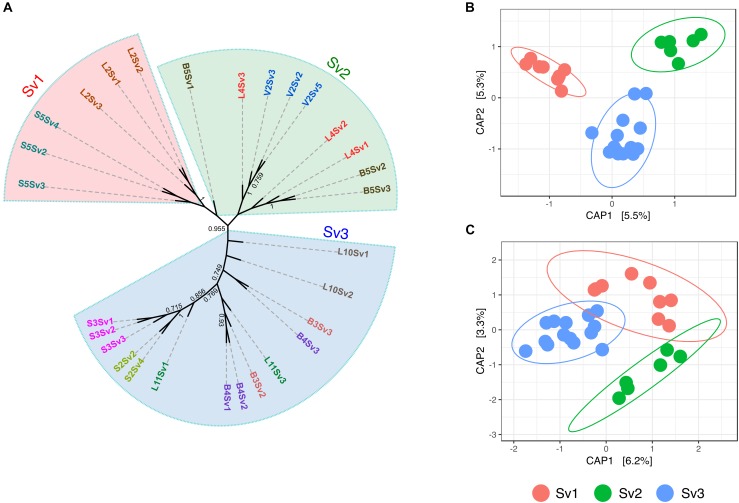
FIGURE 2.
Assessed genotype groups of S. viridis samples and the relevance of these in the bacterial endophyte communities of roots and panicles (A) Maximum parsimony tree show the relatedness of the S. viridis samples enclosed by genotype groups Sv1, Sv2, and Sv3. Principal coordinate analysis (PCoA) biplot of the microbial communities of (B) roots and (C) panicles of S. viridis. PCoA were constrained to genotype groups.

