FIGURE 3.
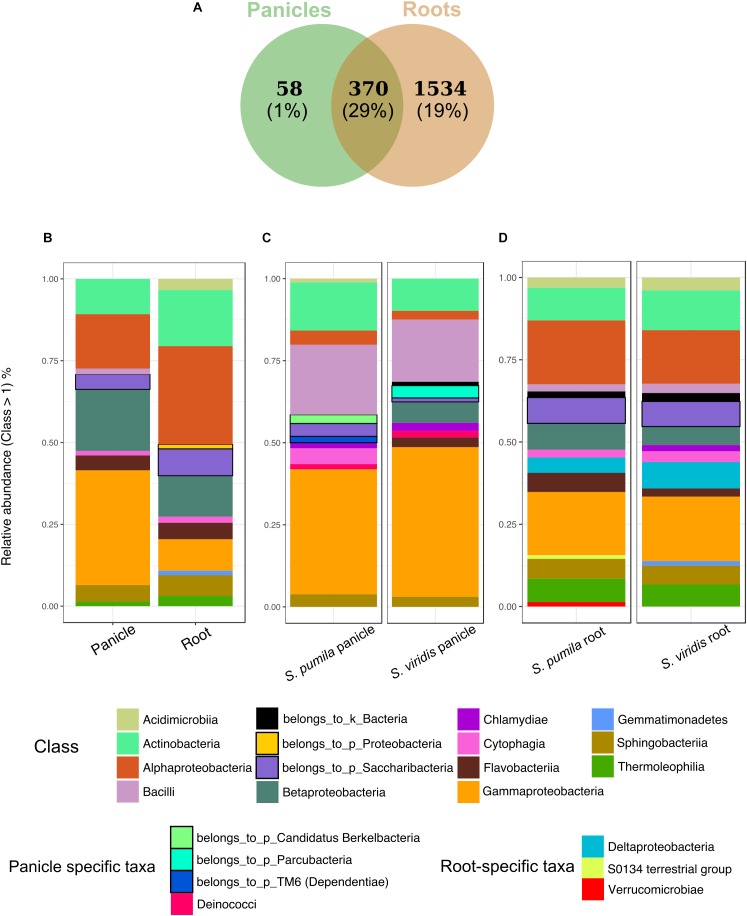
Bacterial endophytic communities of root and panicle samples. (A) Numbers of rOTUs in roots and panicles and their contribution to the overall read count (%). (B) Taxonomic structures of the shared communities (n = 370) in each plant organ. (C) Taxonomic distribution of panicle-specific communities (n = 58) for each plant species. (D) Taxonomic distribution of root-specific communities (n = 1534) for each plant species.

