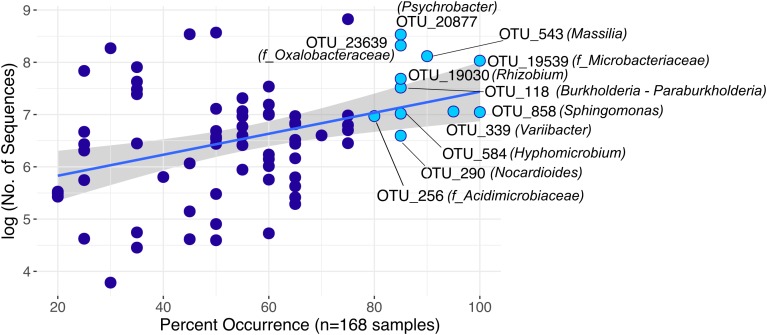
FIGURE 5.
Highly distributed rOTUs (n = 75) across all sample types. Each rOTU is a point, and the line shows the log-linear model for the occurrence/abundance relationship. The gray shading represents the standard error. Highlighted rOTUs represent the core microbiota detected in samples of at least 80% of all locations.

