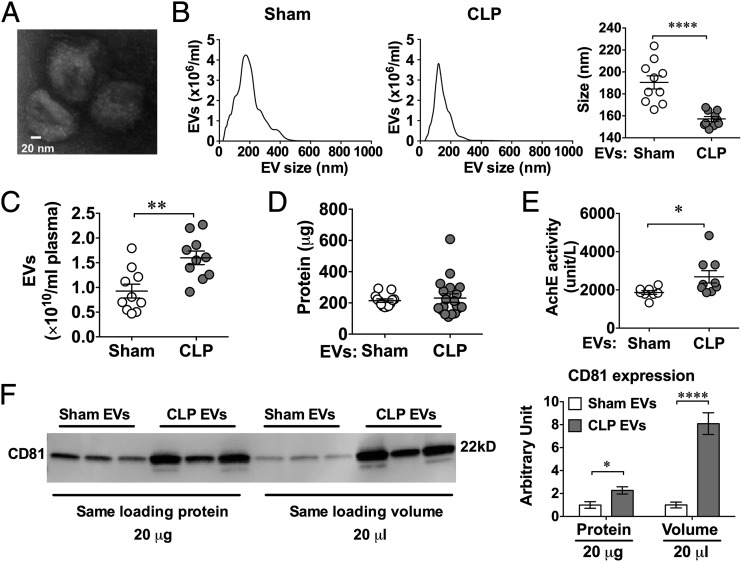
FIGURE 1.
Characterization of EVs isolated from the plasma of CLP and sham mice. (A) A representative electron microscopic image of septic plasma EVs. Mice were subjected to sham or CLP surgery. EVs were purified from plasma 24 h after surgery. Scale bar, 20 nm. (B) Plasma EV size distribution as measured by NanoSight. (C) EV particle numbers as quantified by NanoSight. (D) Protein quantification of EVs derived from 250 μl of plasma by Bradford assay. (E) EV AchE activity. (F) CD81 protein expression in EVs was quantified by Western blot, loading with the same amount of EV protein (20 μg) or the same volume of EV solution (20 μl) (n = 3). *p < 0.05, **p < 0.01, ****p < 0.0001.

