Figure 3.
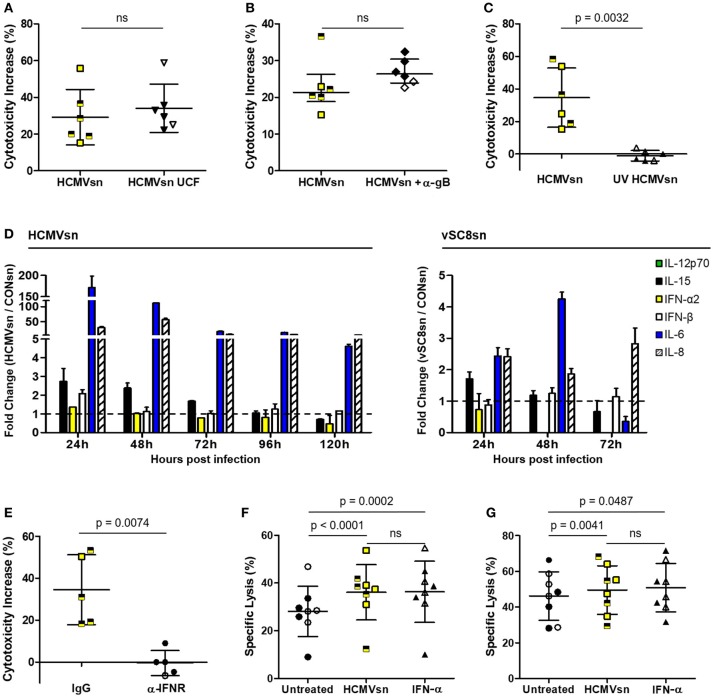
Identification of cytokines produced by HCMV-infected MRC-5 cells. The effect of HCMVsn on NK cell cytotoxicity was assessed by 51Cr release using K562 target cells at E:T 30:1 after removal (A) of insoluble materials by ultracentrifugation (HCMVsn UCF) or (B) HCMV particles with monoclonal anti-gB and goat anti-mouse IgG Dynabeads. (C) Ultraviolet-light inactivated virus was used to generate UV HCMVsn and its effect on NK cell cytotoxicity was measured as above (n = 6). Subjects seropositive for HCMV are represented with filled black circles or triangles and yellow squares half-shaded black. Error bars in (A,C) represent mean ± SD with conditions compared using Student's paired t-test and (B) median with IQR and conditions compared by Wilcoxon signed-rank test. (D) Luminex analysis of HCMVsn collected at 24 h intervals over 120 h (left panel) or vSC8sn collected at 24 h intervals over 72 h (right panel) compared IL-6, IL-8, IL-15, IL-12p70, IFN-α2, and IFN-β concentrations. Data shown represents fold change in the amount of cytokine detected in HCMVsn or vSC8sn/CONsn performed in duplicate ± SD. (E) PBMC (n = 5) were pretreated with 5 μg/ml of IgG control or anti-IFNAR before incubation with CONsn or HCMVsn in a 5 h 51Cr release assay. Bars represent mean ± SD performed in duplicate with conditions compared using Student's paired t-test. The effect of 20 pg/mL recombinant IFN-α2 was compared to that of HCMVsn on NK cell (F) natural cytotoxicity and (G) ADCC (n = 8). Bars represent mean ± SD, performed in triplicate with conditions compared using Student's paired t-test. Data in (A–C,E–G) represent percent cytotoxicity increase or percent specific lysis, respectively, calculated as described in the legend for Figure 1.

