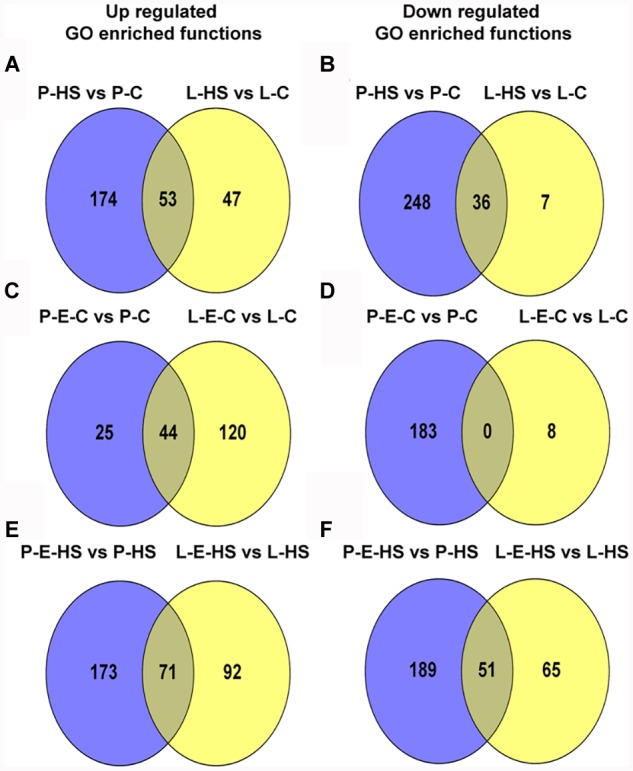
FIGURE 8.

Venn diagrams comparing between pollen and leaf enriched GO functional terms in the biological process category for the four applied treatments. A, C, E and B, D, F relate to the up- and down-regulated GO terms, respectively. The following treatments were used for both leaf and pollen: HS, exposure of plants for 2 h to 50oC; C, 2 h at 25oC (control conditions); E-C, plants pre-treated with 1 ppm ethephon followed by maintaining the plants at control conditions; E-HS, plants pre-treated with 1 ppm ethephon followed by exposing the plants to HS conditions.
