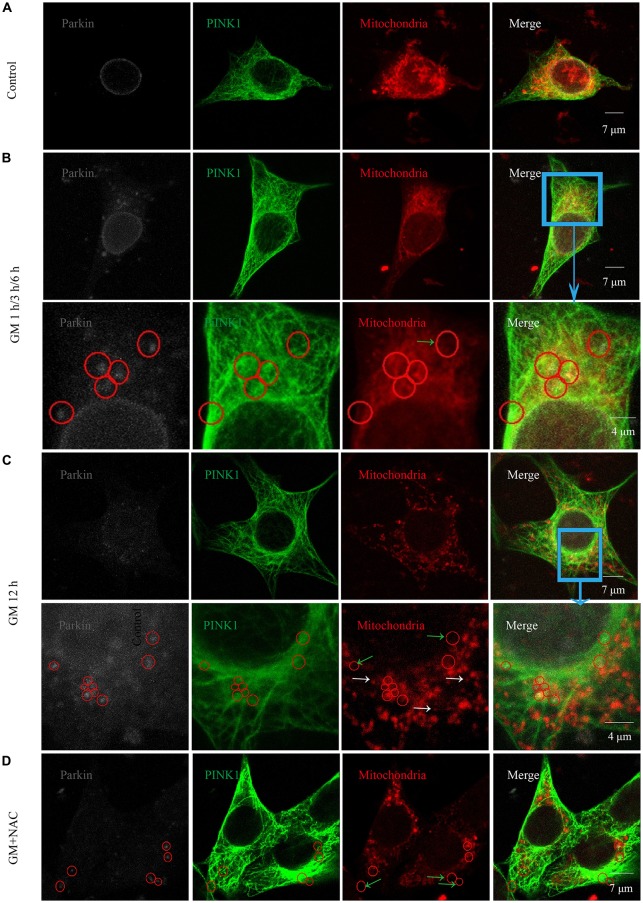
Figure 3.
GM treatment led to the aggregation of parkin to mitochondria which was reduced by co-treatment of NAC. (A) In the experiment, parkin marked by gray fluorescence, PINK1 by green fluorescence and mitochondria by red fluorescence. There were almost no parkin particles in cytoplasm of control HEI-OC1 cells. (B) Obvious parkin particles were detected colocalized with PINK1 and mitochondria (red circles) after GM treatment for 1 h, 3 h and 6 h, and there were also some parkin+/PINK1+ double positive particles not colocalize with mitochondria (green arrows). The major difference of the designed time points was the ratio of parkin-particle positive cells, which would be showed in Figure 4. (C) In addition to the parkin particles, including the ones not in mitochondria (green arrows), cells in the group treated for 12 h showed a large number of punctiform mitochondria (white arrows). (D) Cells of GM and NAC co-treatment groups at all the time points showed sharply decreased number of parkin particles distributed in the cytoplasm.

