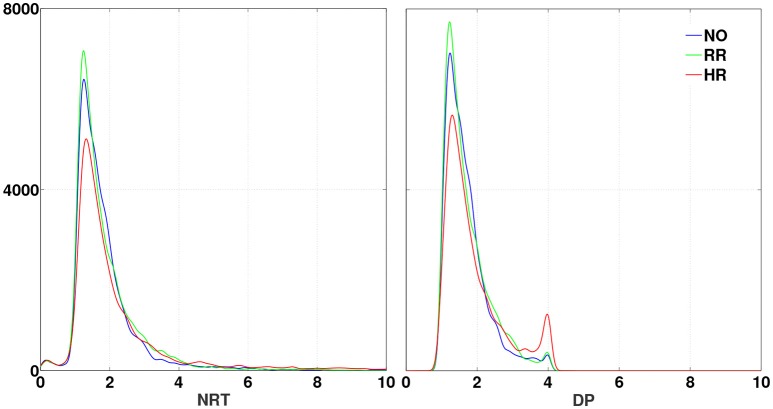
Figure 4.
PDFs of NRT (Left) and DP (Right) for the sleep-related fatigue levels NO (blue), RR (green), and HR (red). All distributions are super-Gaussian like. The DP distributions exhibit a second peak, which is the highest for the HR level of sleep-related fatigue. The density was estimated at every 100 points.

