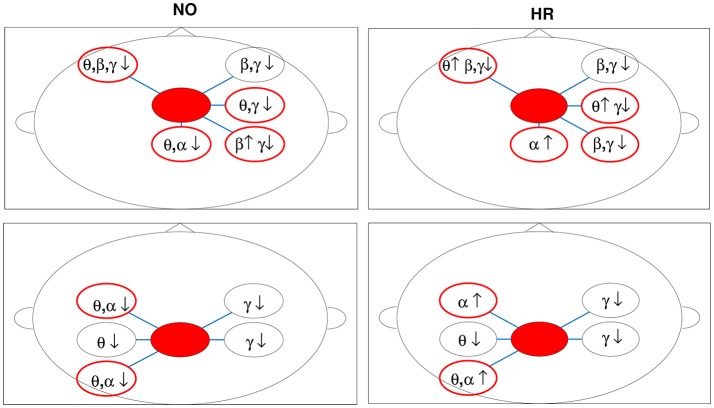
Figure 6.
Brain network changes for fatigued drivers (grand averages for DPs between 2 and 4) in the sleep-related fatigue levels NO (good quality sleep) and HR (poor quality sleep). The Frontal Midline and Parietal Midline areas were considered sources (red filled circles) of the effective connectivity and the CCM-power correlations were analyzed. Augmentation and suppression in the neural rhythms are indicated respectively by up and down arrows. The red circles indicate target areas with different spectral activity (augmentation-suppression) between levels.

