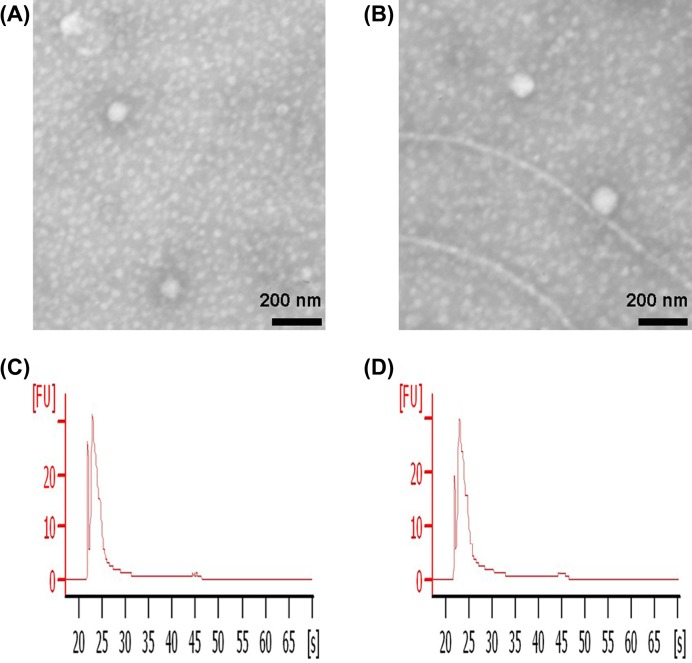
Figure 1. Exosome characterization.
(A) Representative micrograph of TEM of A/exo (scale bar = 200 nm). (B) Representative micrograph of TEM of S/exo (scale bar = 200 nm). (C) A bioanalyzer profile of total RNA showed that A/exo were enriched in small RNAs. (D) A bioanalyzer profile of total RNA showed that S/exo were enriched in small RNAs.

