
Figure 10.
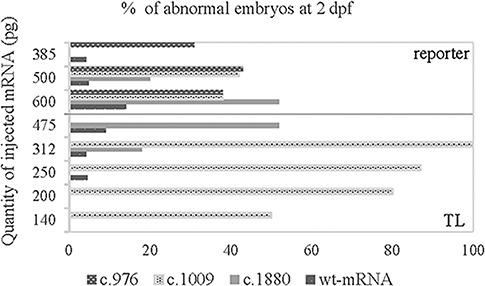
Increase of the number of abnormal embryos after injection of mutant mRNAs. Graphic representation of the percentage of abnormal embryos (number of abnormal embryos as compared to the total number of surviving embryos at 2 dpf) of injections with mutant or wild-type mRNA as indicated in the figure. The percentage of abnormal embryos of the non-injected embryos were not shown since no abnormalities were seen. Injections were performed in the wild-type strain (TL; below line) or reporter strain (above line).