Figure 4.

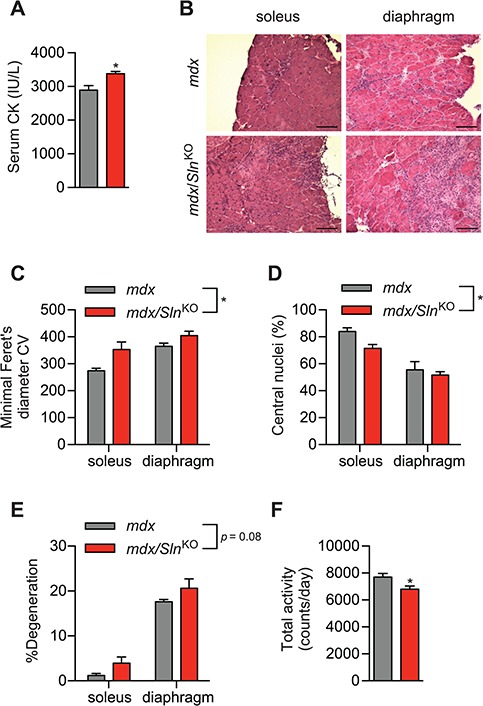
The mdx/SlnKO muscles display worsened dystrophic pathology compared with mdx muscles. (A) Serum CK levels from mdx/SlnKO and mdx mice. (B) H&E staining showing worsened dystrophic myopathy in mdx/SlnKO muscles with increased variability in the minimal Feret’s diameter, (C) lowered central nuclei counts (D) and increased muscle degeneration (% mononuclear cell and connective tissue infiltration; E). Total cage activity using CLAMS revealed a significant reduction in total activity in mdx/SlnKO mice compared with mdx. For (A) and (F), *denotes significance using a Student’s t-test comparing mdx versus mdx/SlnKO muscles, P ≤ 0.05; for (C-E), *denotes a significant main effect when using a two-way ANOVA, P ≤ 0.05. For CK and histological analyses, n = 3–4 per group; and for total activity, n = 8–13.
