
Figure 2.
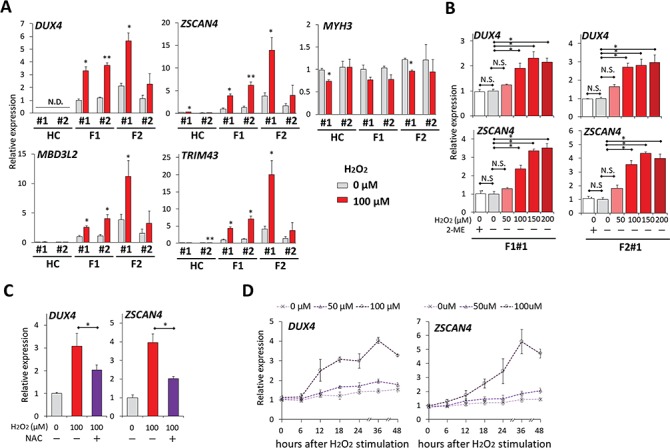
OS increased DUX4 expression in FSHD myocytes. (A) RT-qPCR was performed for DUX4, its downstream targets (ZSCAN4, TRIM43 and MBD3L2) and MYH3 in HC#1, HC#2, F1#1, F1#2, F2#1 and F2#2 myocytes incubated with or without 100 μM H2O2 for 24 h at day 8 after differentiation (n = 3 for each condition). Relative expression levels were normalized to RPLP0 as an internal control in each sample and then to F1#1 without H2O2. (B) RT-qPCR was performed for DUX4 and ZSCAN4 in F1#1 and F2#1 myocytes incubated with 2-mercaptoethanol (2-ME) or with H2O2 at various concentrations for 24 h at day 8 after differentiation (n = 3 for each condition). Relative expression levels were normalized to RPLP0 as an internal control in each sample and then to the condition with 0 μM H2O2 without 2-ME in each clone. (C) NAC was pretreated 1 h before H2O2 stimulation to F1#1 myocytes at day 8. 24 h after H2O2 addition, RT-qPCR was performed for DUX4 and ZSCAN4 (n = 3 for each condition). Relative expression levels were normalized to RPLP0 as an internal control in each sample and then to the condition without H2O2 or NAC. (D) Time-course analysis of DUX4 and ZSCAN4 mRNA expression by RT-qPCR after H2O2 stimulation (n = 3 per each time point). Relative expression levels were normalized to RPLP0 as an internal control in each sample and then to the condition with 0 μM H2O2. Data information: all data are represented as mean ± SEM. *P ≤ 0.05, *P ≤ 0.01 [Student’s t-test in (A) and (C), one way ANOVA followed by Dunnett’s Multiple Comparison Test in (B)].