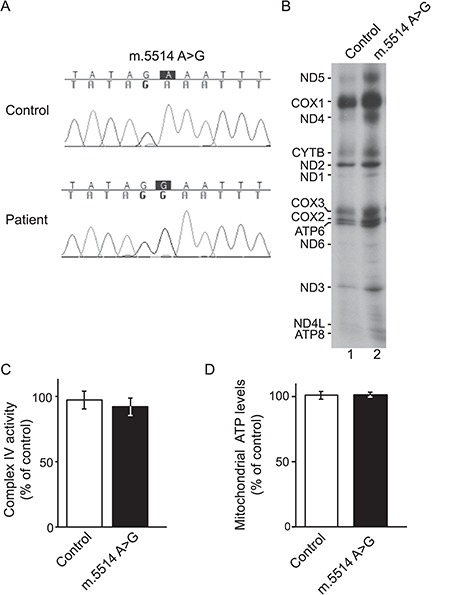
Figure 3.

A nuclear genetic basis of the mitochondrial phenotype. (A) Sequencing electropherogram showing the presence or absence of the m.5514A>G in A549 cybrid cells. (B) In vivo labelling of mitochondrial translation products in control and mutant cybrids. Samples were analysed by SDS-PAGE and autoradiography. (C) Cytochrome c oxidase enzymatic activity, normalized by the enzymatic activity of CS, of mutant cybrid cells relative to control cybrids (Standard deviation (STDEV), n = 3). (D) Levels of mitochondrial ATP in mutant cybrids compared to control (STDEV, n = 6).
