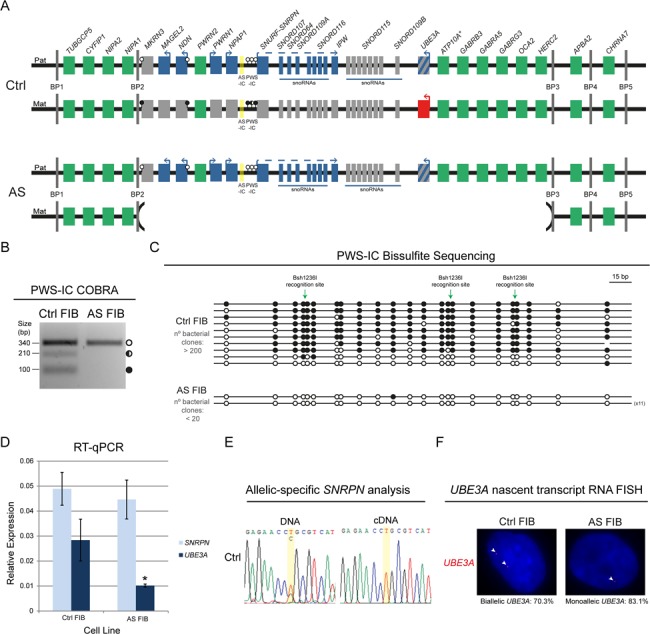
Figure 1.

Stable imprinting of the chr15q11-q13 region in Ctrl and AS FIBs. (A) Scheme of the predictive epigenetic and transcriptional profile of the human chr15q11-q13 region in Ctrl and AS FIBs. Green rectangles, non-imprinted genes (* indicates that ATP10A imprinting status is uncertain); blue rectangles, imprinted genes expressed from the paternal allele; red rectangles, imprinted genes expressed from the maternal allele; gray rectangles, non-expressed imprinted genes; the rectangle with blue and gray stripes represents neuronal-specific imprinted expression of the paternal UBE3A gene; AS-IC is highlighted in yellow; white lollipops, unmethylated DNA; black lollipops, fully methylated DNA; half black lollipops, partially methylated DNA; Pat, paternal allele; Mat, maternal allele; BP1 to 5, breaking points 1 to 5. (B) PWS-IC COBRA for Ctrl and AS FIBs. White circle, unmethylated band; half black circle, partially methylated band; black circle, fully methylated band. (C) Bisulfite sequencing analysis for PWS-IC in Ctrl and AS FIBs. Each line represents the methylation profile of an independent PCR amplicon as determined by Sanger sequencing and BiQ Analyser. White dots, unmethylated CpGs; black dots, methylated CpGs; Bsh1236I recognition sites used for PWS-IC COBRA are indicated; the numbers in brackets represent the number of times the same amplicon was sequenced; estimated number of bacterial clones obtained in the Luria-Bertani (LB) agar plates is indicated. (D) RT-qPCR analysis for SNRPN and UBE3A in Ctrl and AS FIBs. Relative expression has been normalized to the GAPDH housekeeping gene; data are the mean ± standard error of the mean (SEM) of at least three independent experiments; significant differences between Ctrl and AS FIBs are indicated with an asterisk as P-value < 0.05, unpaired Student’s t-test. (E) Allelic-specific SNRPN genomic and expression analysis in Ctrl FIBs assayed by Sanger sequencing. Yellow stripe indicates the rs705 SNP. (F) UBE3A nascent-transcript RNA FISH in Ctrl and AS FIBs. Percentage of biallelic/monoallelic UBE3A FISH signals was calculated by counting a minimum of 64 cells per sample.
