Figure 4.

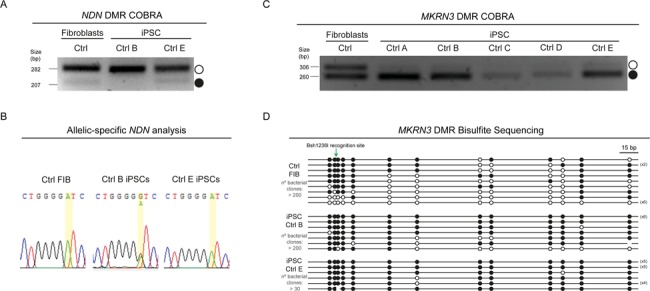
MKRN3 DMR, but not NDN DMR, is hypermethylated in Ctrl iPSCs. (A) NDN COBRA for Ctrl FIBs, Ctrl B and Ctrl E iPSCs. White circle, unmethylated band; black circle, methylated band. (B) Allelic-specific NDN expression analysis assayed by Sanger sequencing for Ctrl FIBs, Ctrl B and Ctrl E iPSCs. Yellow stripe indicates the rs2192206 SNP. (C) MKRN3 COBRA for Ctrl FIBs and all the isogenic Ctrl iPSCs. White circle, unmethylated band; black circle, methylated band. (D) Bisulfite sequencing analysis for MKRN3 DMR in Ctrl FIBs, Ctrl B and Ctrl E iPSCs. Each line represents the methylation profile of an independent PCR amplicon as determined by Sanger sequencing and BiQ Analyser; white dots, unmethylated CpGs; black dots, methylated CpGs; Bsh1236I recognition site used for MKRN3 DMR COBRA is indicated; the numbers in brackets represent the number of times the same amplicon was sequenced; estimated number of bacterial clones obtained in the LB agar plates is indicated.
