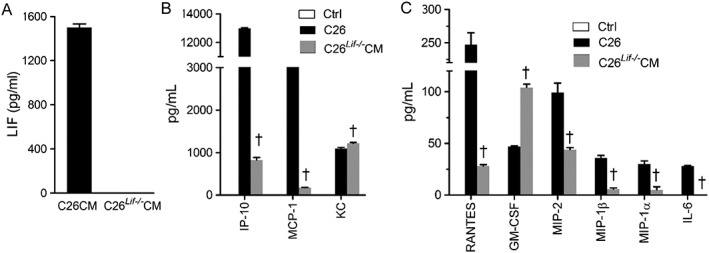
Figure 2.

Cytokine concentrations in conditioned medium (CM) from C26 and C26Lif−/− cells. (A) LIF. (B) IP‐10, MCP‐1, and KC concentration. (C) RANTES, GM‐CSF, MIP‐2, MIP‐1β, MIP‐1α, and IL‐6 concentration. ctrl = control. All values plotted (black and grey bars) are significantly greater than control values measured in DM (not detected). The CM made was used for all experiments, and cytokine levels were measured in triplicate in all cases. †Significantly different from C26 value (P < 0.05).
