
Figure 3.
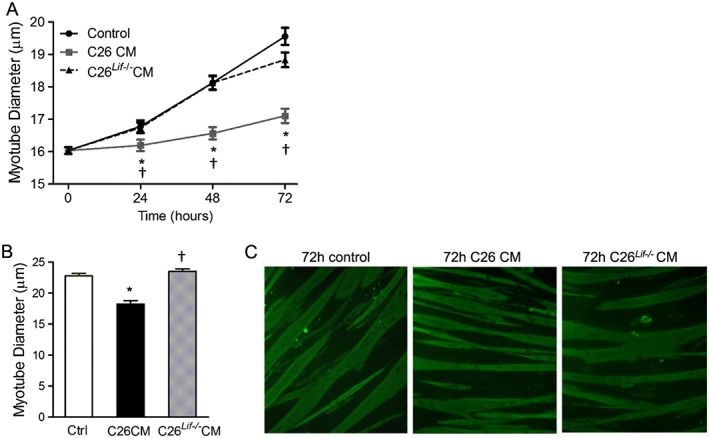
Diameter of control (ctrl), C26 CM, and C26Lif−/− CM‐treated myotubes. (A) Measurements made at 0 (day 4), and 24, 48, and 72 h of treatment with C26 CM or C26Lif−/− CM. At least 100 myotubes were measured per group. (B) Measurement of fluorescent myotubes after immunocytochemistry at 72 h treatment. (C) Representative images of fluorescent myotubes from 72 h control, C26 CM, and C26Lif−/− CM‐treated groups. *Significantly different from control value at same time point (P < 0.05). †Significantly different from C26 value (P < 0.05).