Figure 4.

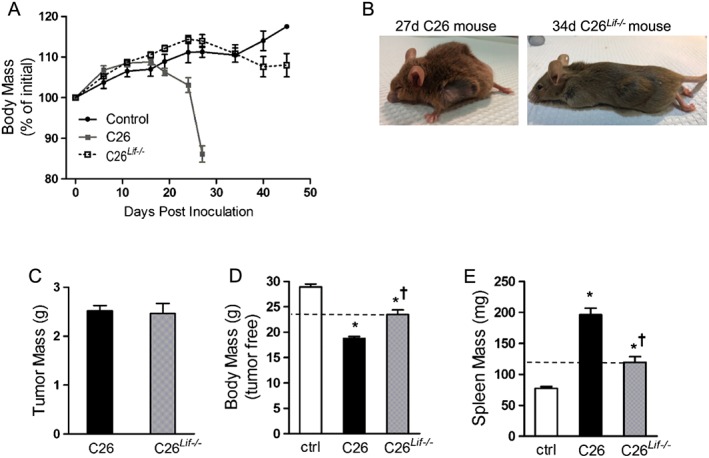
Growth characteristics of control (ctrl), C26, and C26Lif−/− tumour‐bearing mice (n = 12 per group). (A) Body mass during the weeks following tumour cell inoculation. (B) Photographs of tumour‐bearing mice immediately prior to sacrifice. Sacrifice was at 27 days post‐inoculation for C26 mice and 34 to 46 days post‐inoculation for C26Lif−/− mice. (C) Tumour weight at sacrifice. (D) Tumour‐free body mass at sacrifice. (E) Spleen mass at sacrifice. *Significantly different compared with control value (P < 0.05). †Significantly different from C26 value (P < 0.05). A Dunn's post hoc test was used for data in (D) and (E).
