Figure 1.

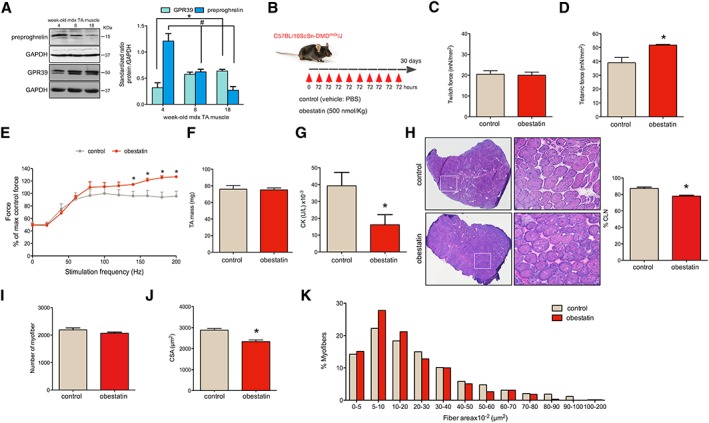
Obestatin treatment improves Duchenne muscular dystrophy (DMD) phenotype in mdx mice. (A) Protein levels of preproghrelin, precursor of obestatin, and GPR39 in the tibialis anterior (TA) muscles of mdx mice of different ages (4‐, 8‐, and 18‐week‐old mdx mice; n = 3 per age group). Protein levels were analysed by immunoblot, and data were expressed as arbitrary units (mean ± SEM; *,# P < 0.05 vs. control values) obtained from intensity scans. (B) A schematic diagram of intramuscular administration of obestatin (500 nmol/kg body weight each 72 h; n = 5) or vehicle (control; n = 5) in TA from mdx mice. (C) Effect of intramuscular injection of obestatin or vehicle on twitch force at 30 days. (D) Effect of intramuscular injection of obestatin or vehicle on tetanic force at 30 days. (E) Force‐frequency curve of TA muscles in obestatin‐treated or vehicle‐treated groups. (F) TA muscle weight after 30 days of treatment with vehicle or obestatin. (G) Serum creatine kinase (CK) levels after 30 days of treatment with vehicle or obestatin. (H) Left panel, representative haematoxylin and eosin staining from vehicle‐treated and obestatin‐treated muscles TA. Right panel, quantitation of myofibres with CNL from TA muscles. Data are shown as % of myofibres with centrally located nuclei (CLN). (I) Quantification of number of myofibres in TA muscles after 30 days of treatment with vehicle or obestatin. (J) Cross‐sectional area of muscle fibres from TA muscles after intramuscular injection of obestatin or vehicle at 30 days (mean ± SEM; n = 5 animals per group; * P < 0.05 vs. control values). (K) Distribution of fibre diameter from vehicle‐treated and obestatin‐treated mice. Data are expressed as % of myofibres. From (C) to (K), data are represented as mean ± SEM and * P < 0.05 vs. control values. CSA, cross‐sectional area; PBS, phosphate‐buffered saline.
